Market recap
What happened in the US market today — at a glance.
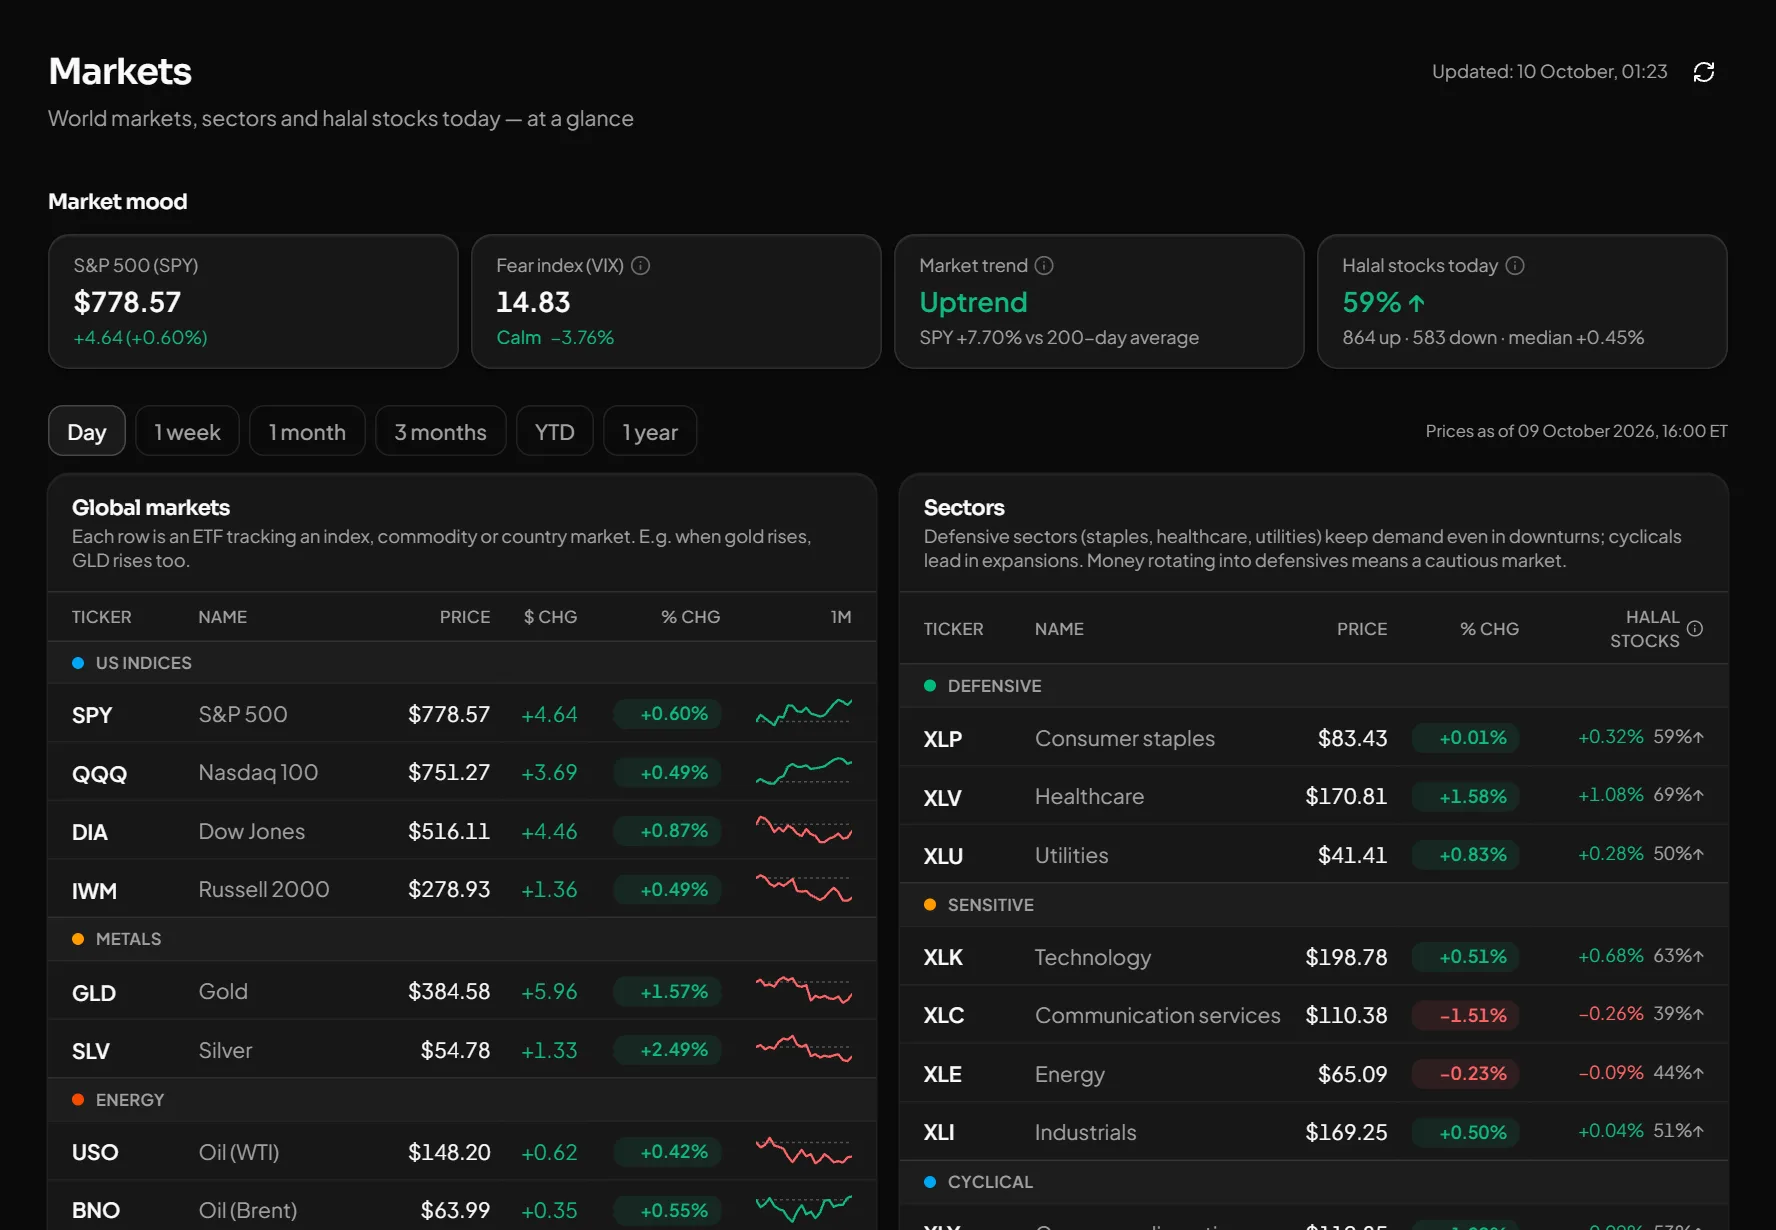
The market recap puts the whole picture on one screen: the S&P 500, the fear index (VIX), the market trend and how halal stocks are doing today. Next to it: global markets and sectors by day, week, month and year. The day's biggest gainers and losers have their own page.
What you get
Market mood
S&P 500, VIX, the trend against the 200-day average and the share of halal stocks that rose — in four numbers.
Global markets and sectors
Indices, gold, silver, oil and sector ETFs grouped as defensive, sensitive and cyclical. Each sector also shows its halal stocks' median move and the share that rose.
Today's movers
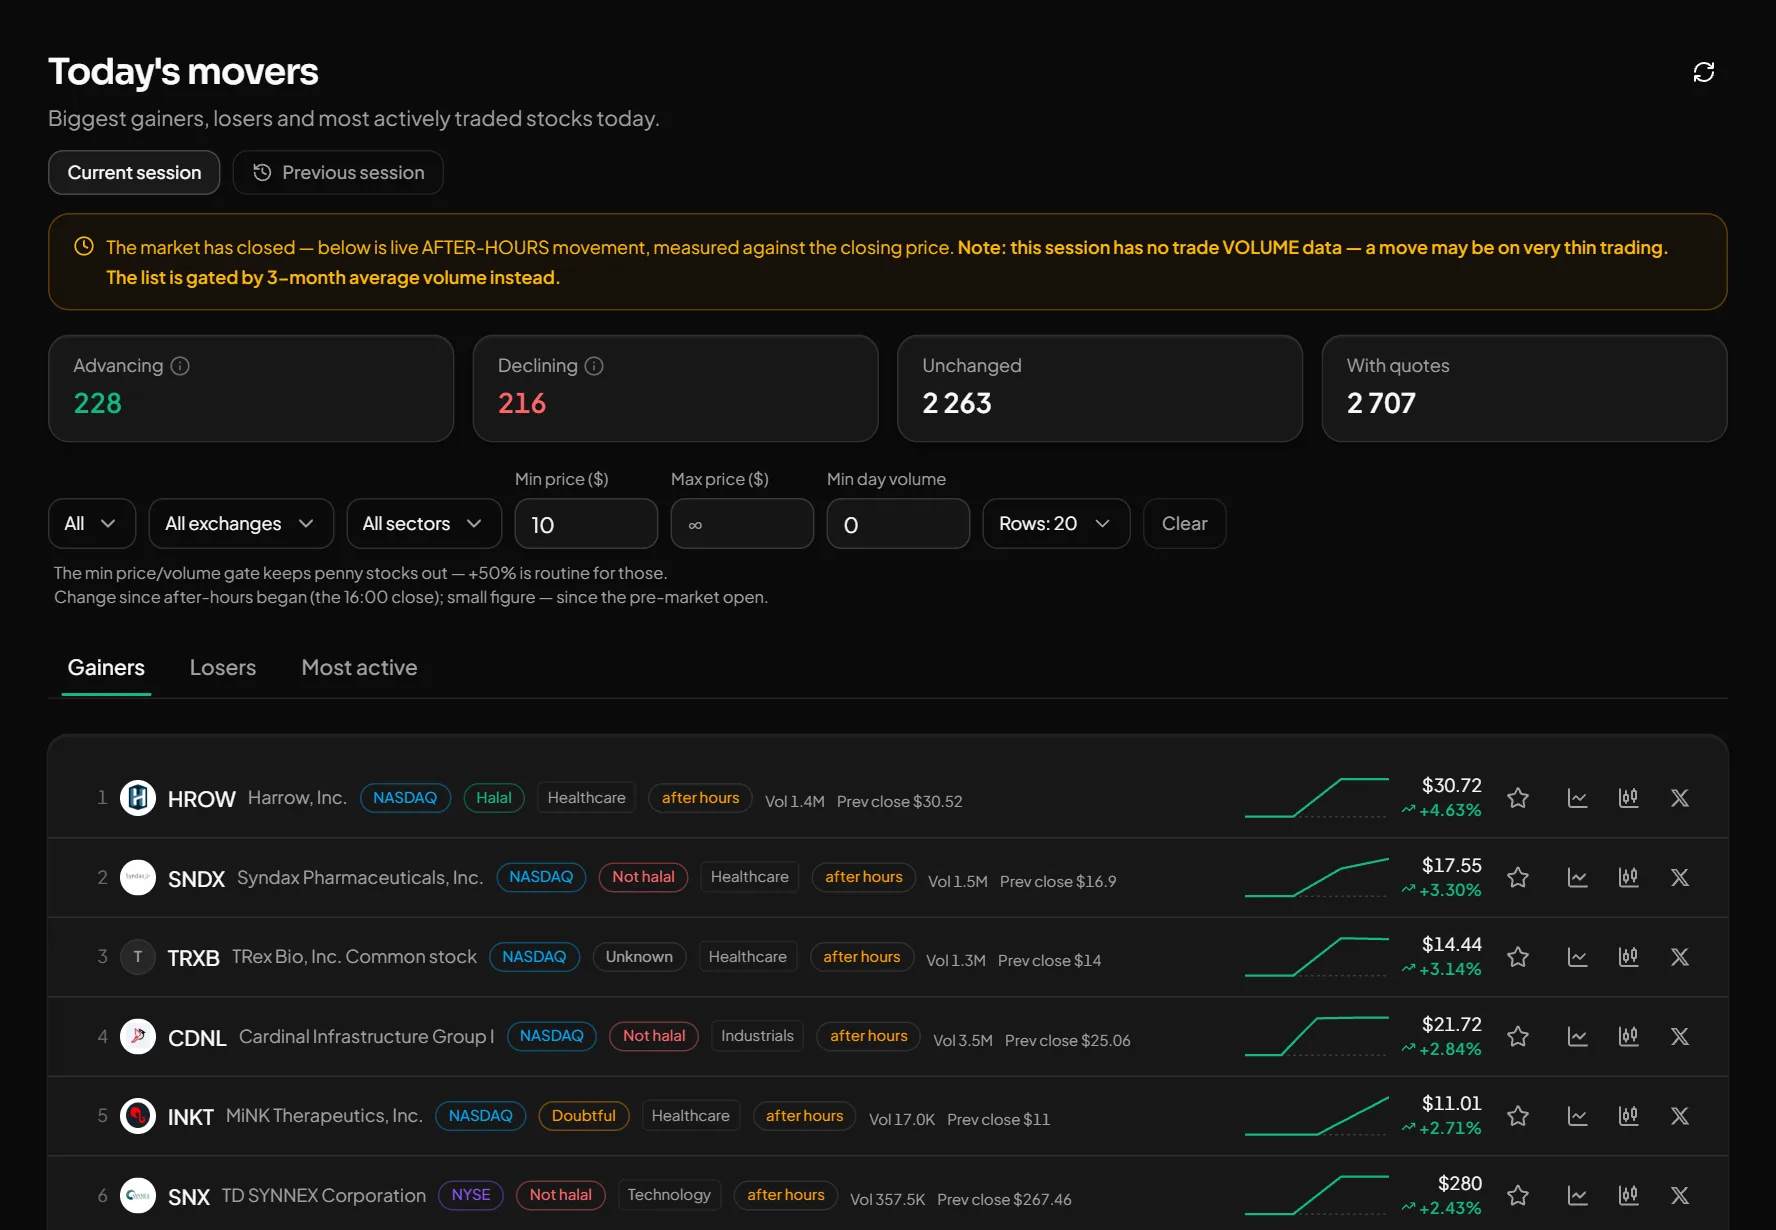
Top gainers, losers and most active stocks — including pre-market and after-hours moves. A price and volume gate keeps penny stocks out.
How to use it
- 1Open the market recap — the mood and the key numbers sit at the top.
- 2Pick a period: day, week, month, 3 months, year to date or 1 year.
- 3Click a sector or a stock to open its chart and details.
Good to know
- Prices come from Yahoo Finance data.
- Pre-market and after-hours sessions carry no volume data, so a large percentage can come from very thin trading. The page warns about it.
Open an account and try it
Every feature is free for now. Sign up with a phone number or Telegram in a minute.
Start freeOther features
Who reports and when — with the estimate and the actual result side by side.
Inflation, the Fed rate, unemployment and bonds — and the days that move the market.
Every signal comes with an entry, TP, SL and its outcome. The losers stay visible too.
What Buffett and other famous investors hold — from SEC 13F filings.
Get notified the moment a price is hit or a signal fires.
See the numbers before you trade: how much risk, how much reward, how many shares.
Practice at real prices with no real money — every trade is analysed in the journal.
The stocks you follow — with live prices, the result since you added them and a halal badge.