Dashboard
Right after you log in — market state, the quote of the day and signal results on one page.
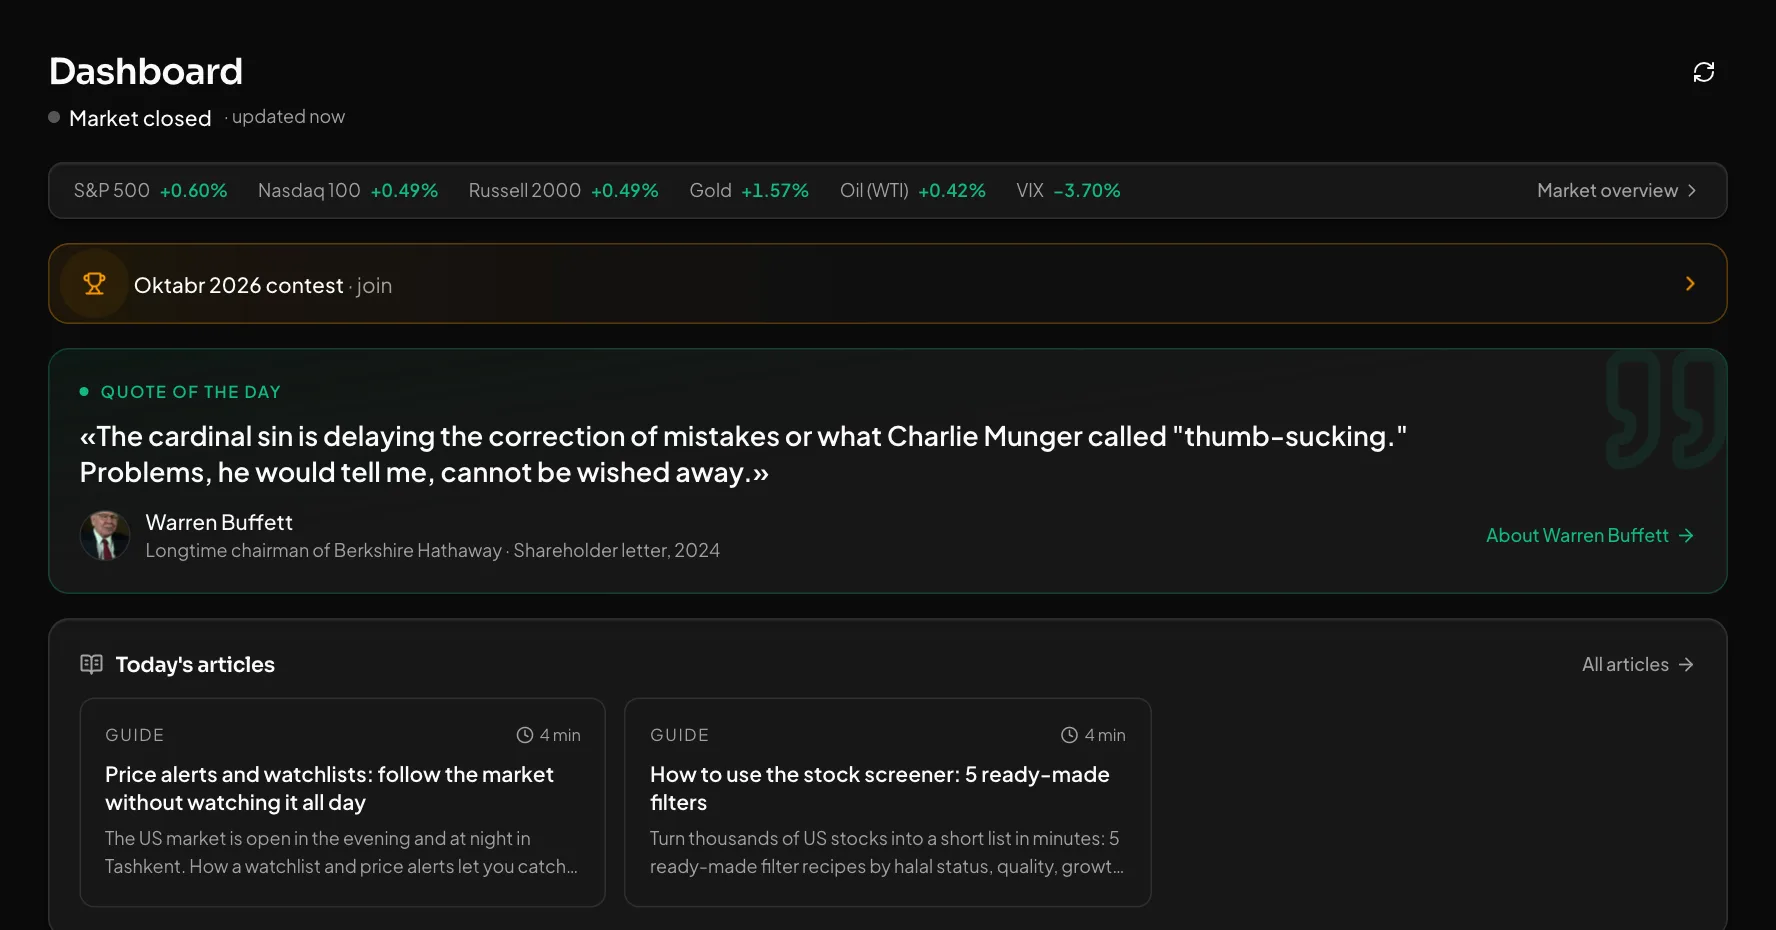
The dashboard is the app's home page. On top: the market session and the main indices. Below: the quote of the day and today's articles. Then the overall signal results: the 30-day result, win rate, open signals and the results curve.
What you get
The market in one row
S&P 500, Nasdaq 100, Russell 2000, gold, oil and VIX with today's change. Whether the market is open, closed or in pre/after-hours, and the time left until the close.
Signal results
30-day result, win rate, open signals and average result. The results curve covers 30 days, 90 days or all time, with a per-strategy table.
Open and closed signals
Open signals with live prices and the latest closes with their results, side by side.
How to use it
- 1Log in — the dashboard opens first.
- 2Click an index or a signal row to open its page.
- 3Pick a period on the results curve: 30 days, 90 days or all.
Good to know
- Results assume an equal amount in every signal with no reinvestment (a sum of percentages).
- Win rate leaves out open signals. These are signal results, not your personal portfolio.
Open an account and try it
Every feature is free for now. Sign up with a phone number or Telegram in a minute.
Start freeOther features
Everything you need before the trading day — on one page.
What happened in the US market today — at a glance.
Every signal comes with an entry, TP, SL and its outcome. The losers stay visible too.
Who reports and when — with the estimate and the actual result side by side.
What Buffett and other famous investors hold — from SEC 13F filings.
Get notified the moment a price is hit or a signal fires.
See the numbers before you trade: how much risk, how much reward, how many shares.
Practice at real prices with no real money — every trade is analysed in the journal.