Whiteboard
Draw out a trading idea — with a real chart, pattern templates and a share link.
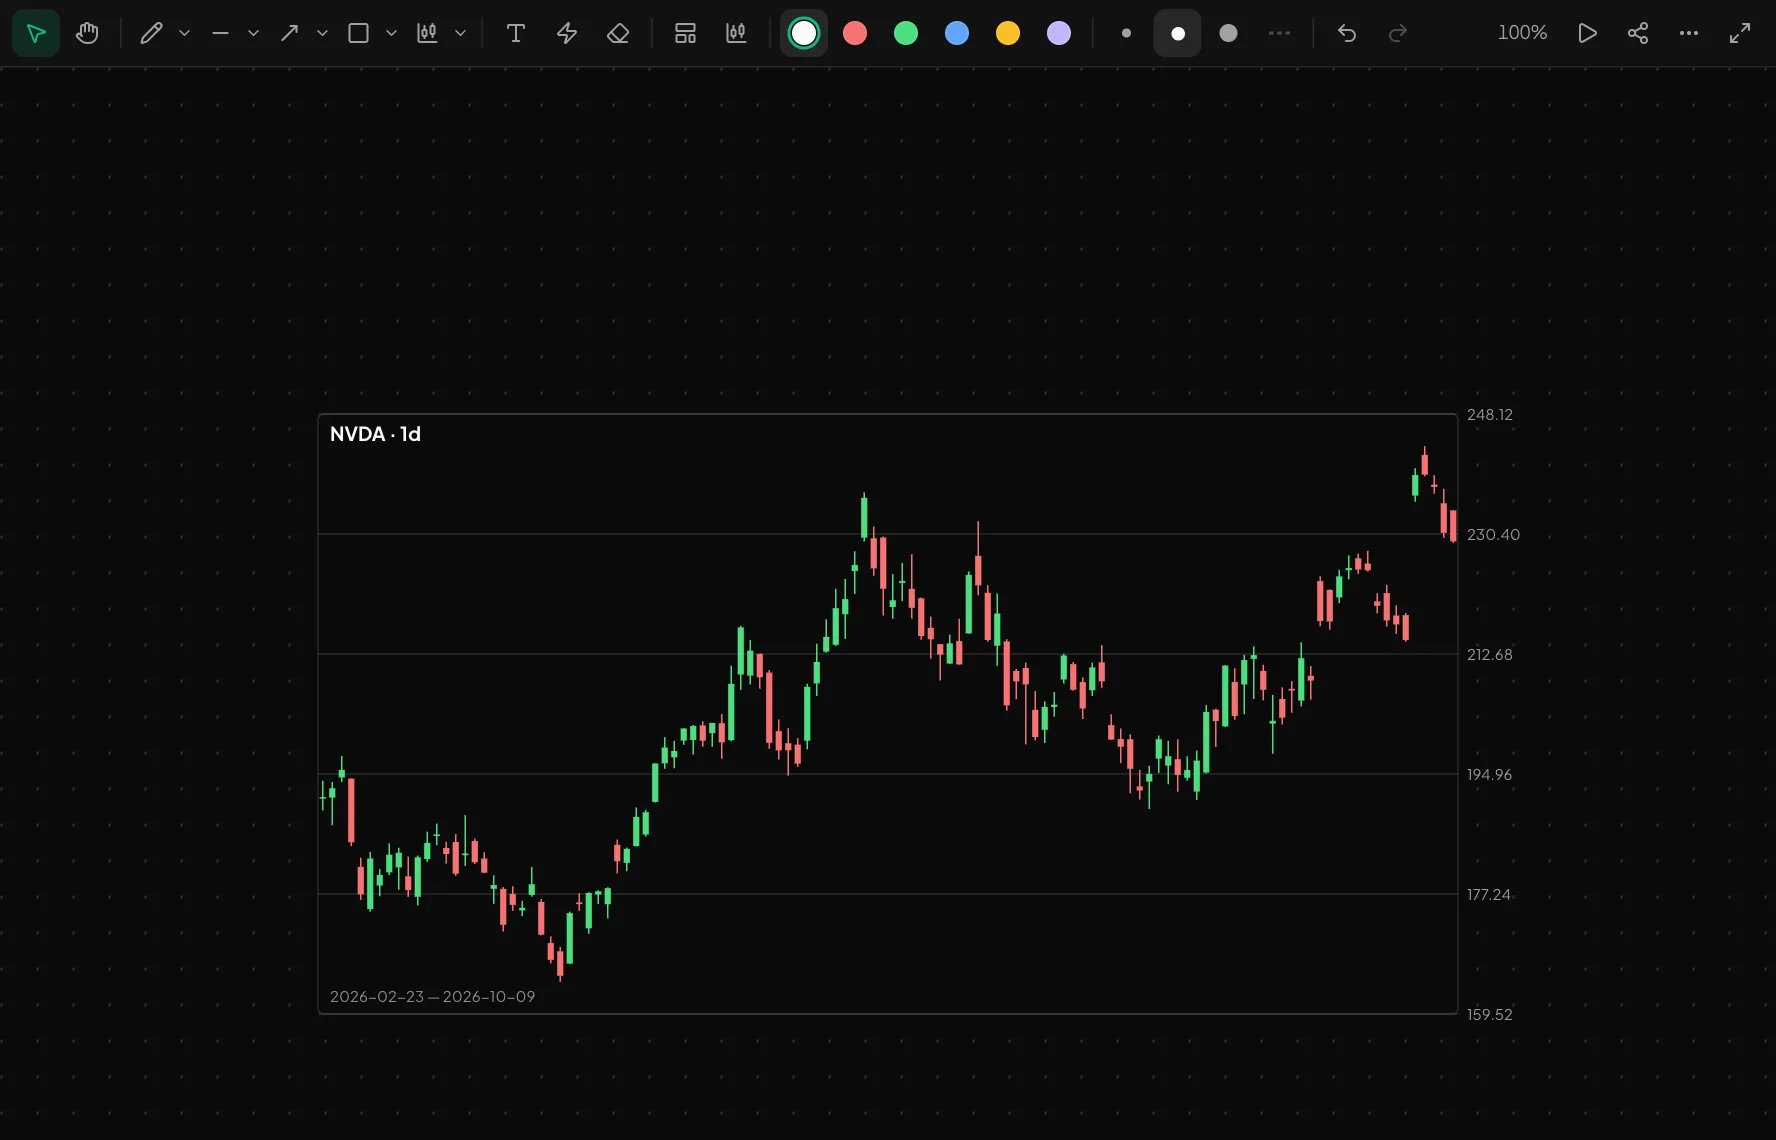
The whiteboard is a drawing space for trading. Drop in a stock's real candles and draw levels, channels, Fibonacci and a risk/reward box on top. Handy for teaching or explaining an idea.
What you get
Trading tools
Besides pen, lines, arrows and shapes: candle, level, trend channel, Fibonacci and a risk/reward box. 6 colours, line width and a dotted or grid background.
27 templates
Chart patterns (head and shoulders, double top, triangles, flags, cup and handle, wedges), candle patterns and level/trend setups — one click each.
Real chart and sharing
Insert 60–250 candles on 1d, 4h, 1h, 15m or 5m. Several pages, replay in drawing order, PNG export and a view-only link.
How to use it
- 1Use "Insert a real chart" to place a stock's candles, or pick a template.
- 2Draw a level, a channel or a risk/reward box on top.
- 3Save it as PNG or share a view-only link.
Good to know
- The drawing is saved in this browser only — move it to another device with a JSON file or a share link.
- No real-time collaboration.
Open an account and try it
Every feature is free for now. Sign up with a phone number or Telegram in a minute.
Start freeOther features
A 35-lesson interactive course on the US stock market and halal investing.
Practise reading charts and financials by playing on real historical data.
What happened in the US market today — at a glance.
Every signal comes with an entry, TP, SL and its outcome. The losers stay visible too.
Who reports and when — with the estimate and the actual result side by side.
What Buffett and other famous investors hold — from SEC 13F filings.
Get notified the moment a price is hit or a signal fires.
See the numbers before you trade: how much risk, how much reward, how many shares.