Compare
Put 2–4 stocks side by side — the best value in each row is green.
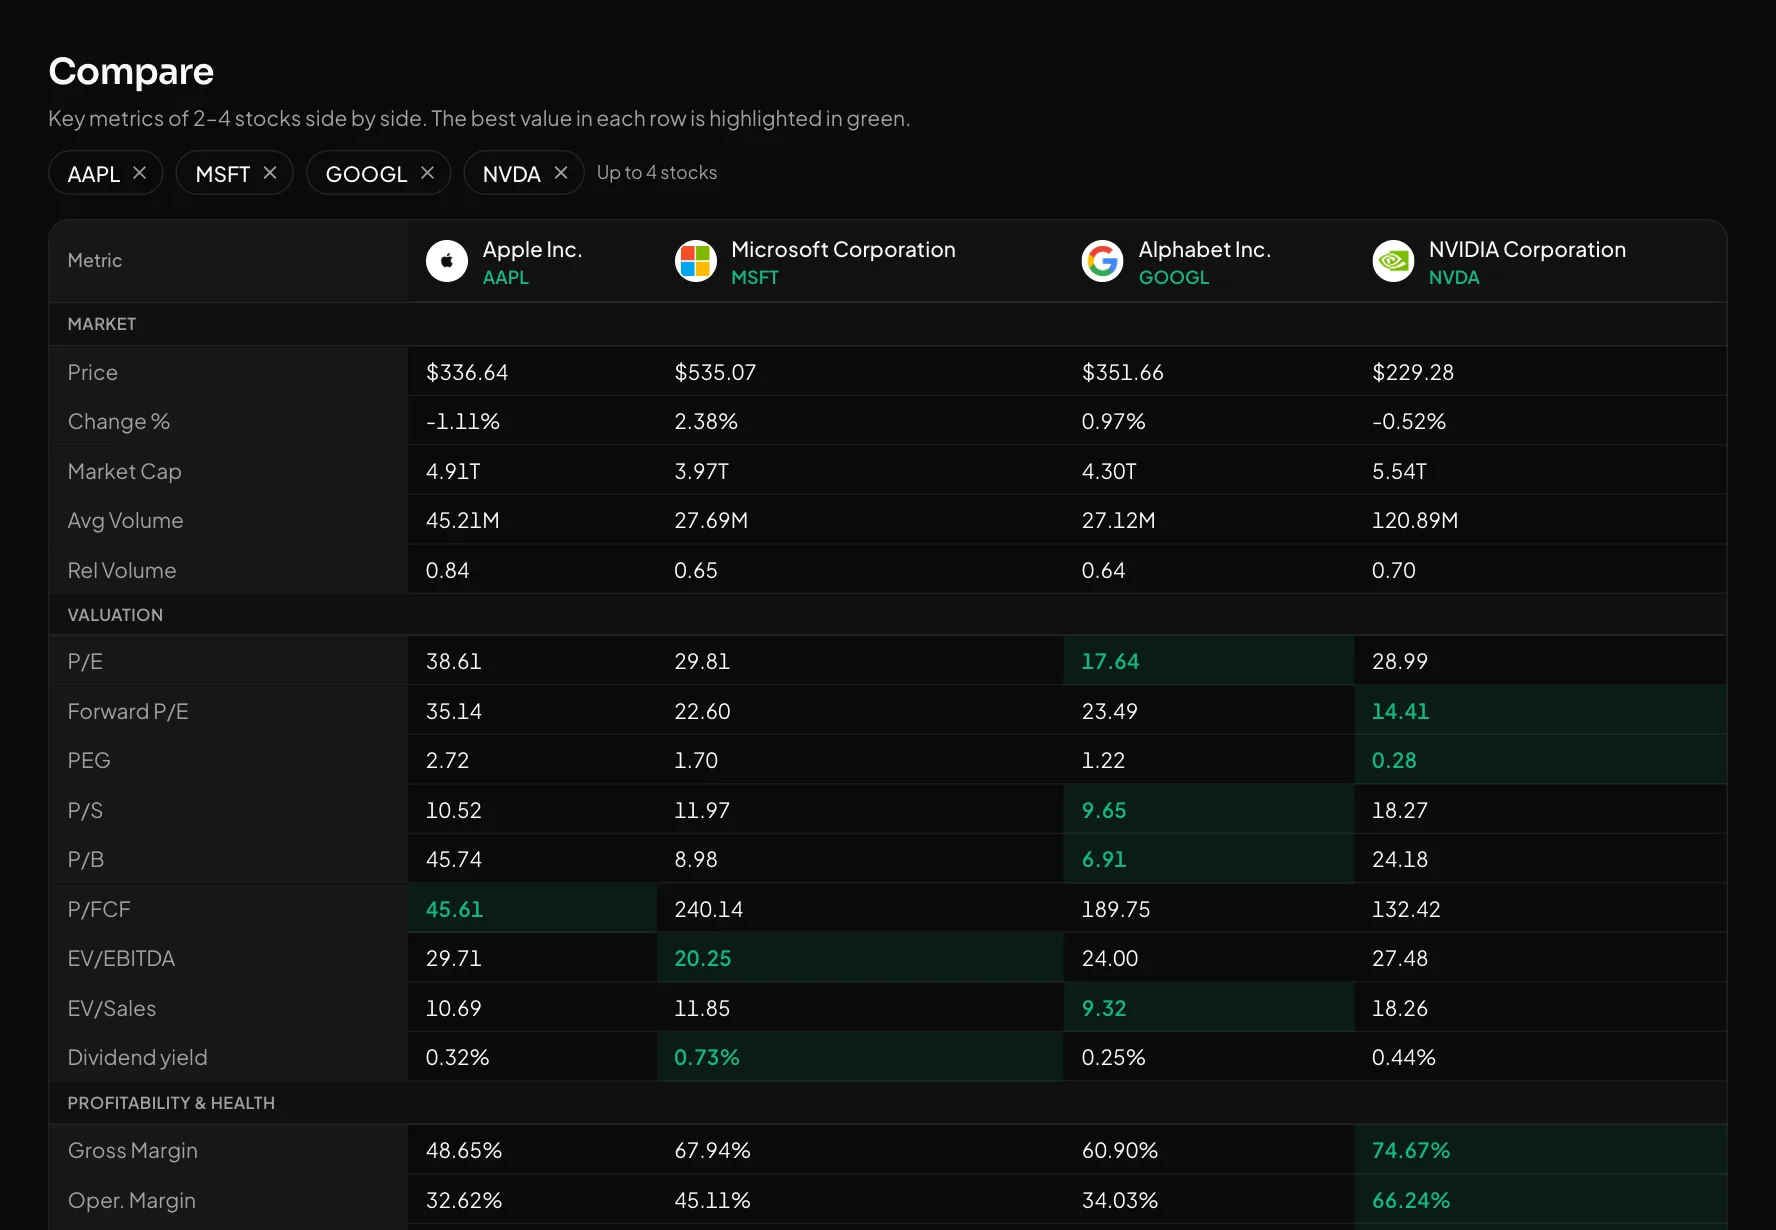
The compare page shows several stocks' metrics in one table: market, valuation, profitability, growth, ownership, technicals and performance. Which one is cheaper or stronger is visible at once.
What you get
One table
P/E, PEG, P/S, EV/EBITDA, dividend, margins, ROE, debt, growth, RSI, moving averages, beta and performance from one week to 5 years.
Best value highlighted
The lowest valuation and the highest profitability and growth are marked in green.
Share by link
The list lives in the URL — send the link and the other person sees exactly this table.
How to use it
- 1Add tickers or pick a ready-made pair (for example NVDA · AMD).
- 2Go through the groups and look at the green cells.
- 3Click a column header to open that stock's page.
Good to know
- Up to 4 stocks. No halal column, chart or export in this table.
Open an account and try it
Every feature is free for now. Sign up with a phone number or Telegram in a minute.
Start freeOther features
What Buffett and other famous investors hold — from SEC 13F filings.
The stocks you follow — with live prices, the result since you added them and a halal badge.
Find the right stocks among 5,000+ US names in minutes.
A stock chart with drawing tools, moving averages and price alerts right on the chart.
Everything about one stock: chart, fundamentals, halal analysis and who is buying.
What happened in the US market today — at a glance.
Every signal comes with an entry, TP, SL and its outcome. The losers stay visible too.
Who reports and when — with the estimate and the actual result side by side.