Chart
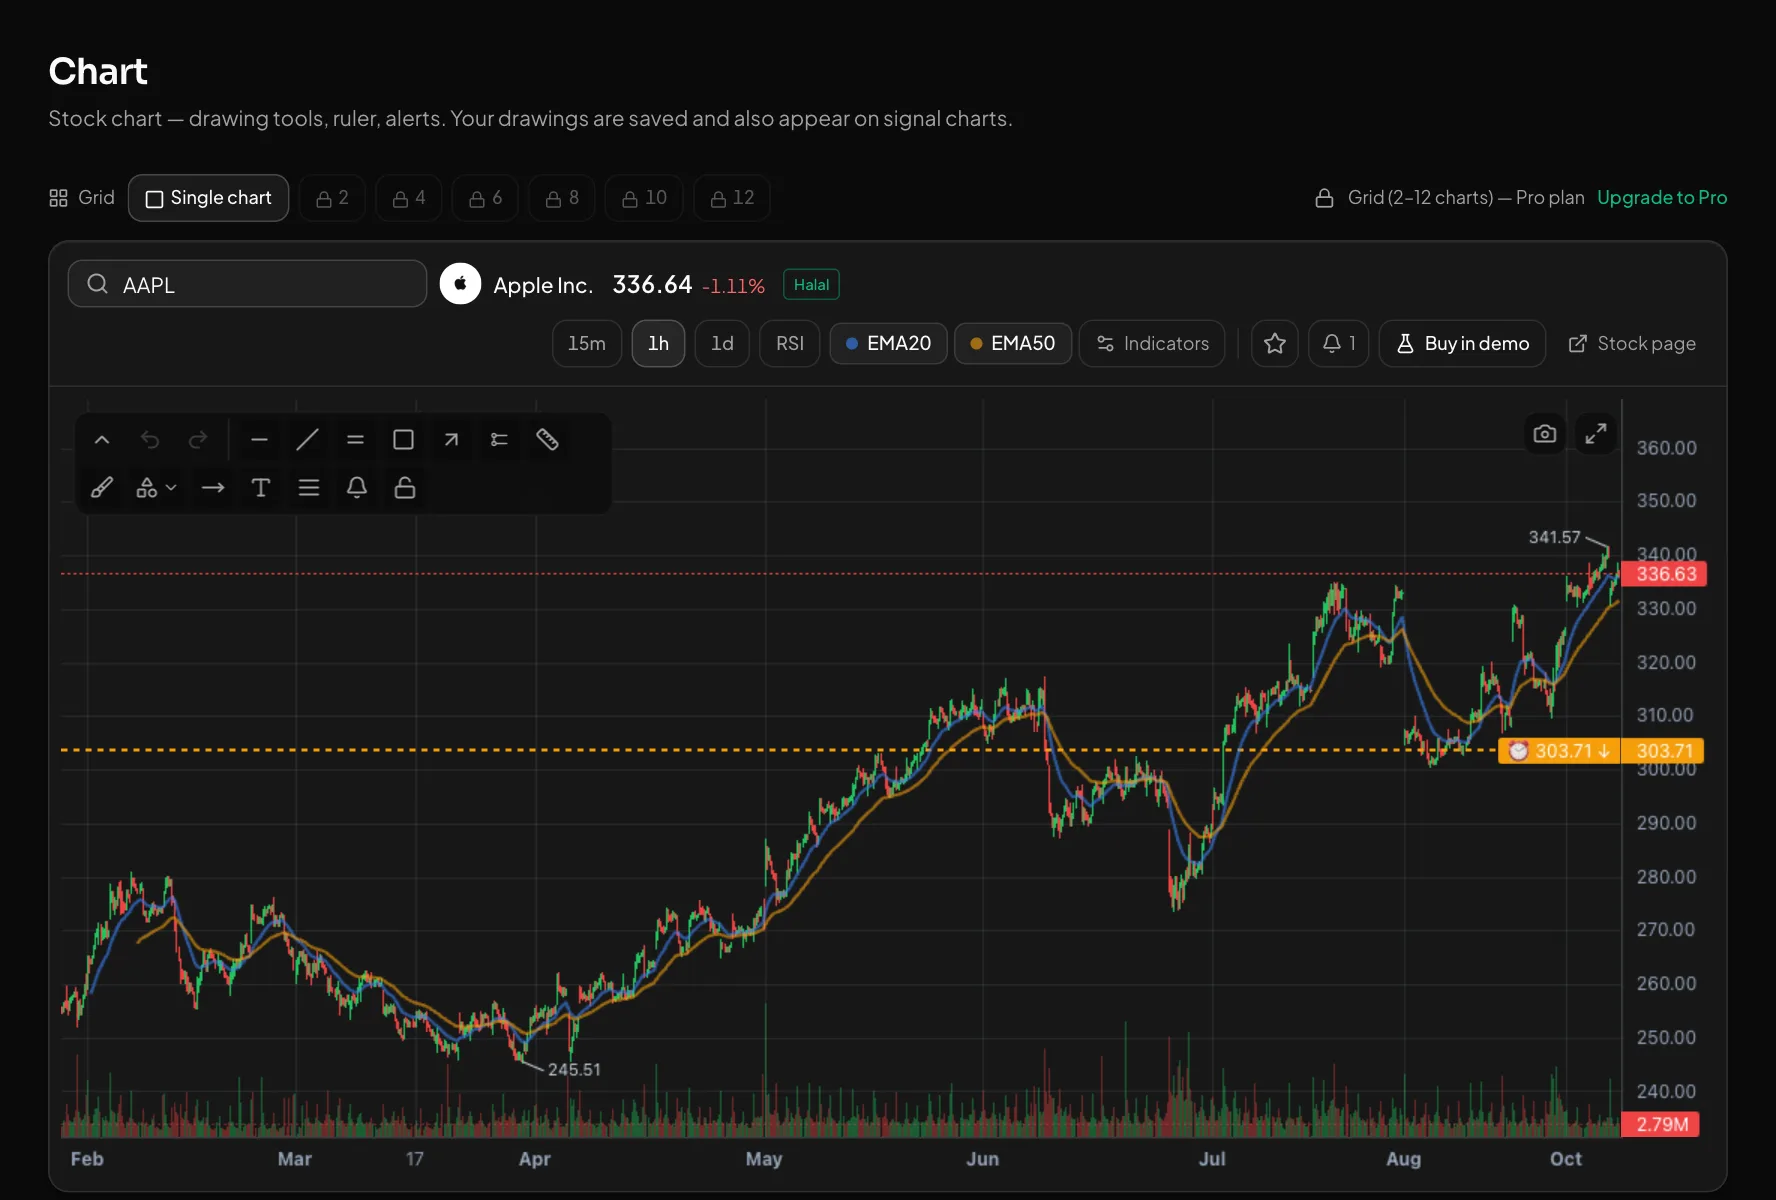
A stock chart with drawing tools, moving averages and price alerts right on the chart.
The chart page shows any US stock on 15-minute, 1-hour or daily candles. Your drawings are saved and also show up on that stock's signal charts.
What you get
Drawing tools
Horizontal and trend lines, channel, rectangle, Fibonacci, long position (risk/reward), ruler, text and more shapes. Undo/redo and PNG export.
Indicators
Up to 8 EMAs, each with its own period, colour and width. An RSI pane and volume. On 15m and 1h, pre/after-hours candles sit on a shaded background.
Alerts from the chart
Pick the bell tool and click the chart to set a price alert. It arrives on the site, as a browser notification and in Telegram. Drag the alert line to move it.
How to use it
- 1Type a ticker or a company name.
- 2Pick a timeframe and turn on the EMAs you want.
- 3Draw a level or set an alert at that price; try it with "Buy in demo".
Good to know
- Three timeframes: 15m, 1h and 1d. Indicators: EMA, RSI and volume.
- Alerts are checked every scan cycle (15 minutes by default), not on every tick. A grid of 2–12 charts is on the Pro plan.
Open an account and try it
Every feature is free for now. Sign up with a phone number or Telegram in a minute.
Start freeOther features
What Buffett and other famous investors hold — from SEC 13F filings.
The stocks you follow — with live prices, the result since you added them and a halal badge.
Find the right stocks among 5,000+ US names in minutes.
Everything about one stock: chart, fundamentals, halal analysis and who is buying.
Put 2–4 stocks side by side — the best value in each row is green.
What happened in the US market today — at a glance.
Every signal comes with an entry, TP, SL and its outcome. The losers stay visible too.
Who reports and when — with the estimate and the actual result side by side.